Features

secure storage

Data Management And Hosting​

Hassle-Free Analytics

Fully Managed

Fully hosted and maintained analytics. Access it from anywhere without the overhead traditionally associated with hosting your own equipment and software.

Highly Scalable

Secure PostgreSQL

Highly Scalable Data Management in a Secure Cloud with AWS.

Flexible Data Access

Multiple Additional Database Connections​

A Data Source record contains the connection details the system uses to access source data for reporting. Connections are then used by Views to provide tables and fields. Through the Admin Console you will be able to create new data sources and associated views. In addition you will be able to manage the security access to these connections.

Flexible Deployment

Private Server​

Our solution will work with all of the major cloud providers including AWS, Azure, GCP, and more.

It can be deployed into any environment as it is both OS agnostic and self-hosted.

This can range from physical servers on a private internal network, to highly dynamic cloud container services such as AWS ECS or Kubernete

Point-in-Time Comparison

Snapshot Backups of Uploaded Data and Instance​

This allows you to save the result set of your current report with the drill paths and filters you’ve currently applied. A snapshot becomes a static report, meaning that you can no longer interact with it, it has been designed to preserve a result set at a point in time to use for comparison later.

Unified Data Access

Data Connectivity and Integration​

Third-Party Integration

Multiple Connectors with Pre-built Content​

This allows users to connect directly to third-party web applications including Xero, Salesforce, Facebook, Twitter, YouTube, and Google Analytics, among many others.

Once connected, users can manipulate web-based data as if it was present in an on-premise database.

Work with Existing Data

External Connectors​

Our solution does not require you to import data, rather it works with data in your existing data sources.

Four main types of data store are supported:

  1. JDBC compliant databases such as SQLServer, Oracle, Exasol, Snowflake, Redshift and many more
  2. XML/A compliant cubes such as Microsoft Analysis Services, SAP BW, Oracle Essbase
  3. CSV files (which are then loaded in to a relational database)
  4. Third-Party sources including applications like Salesforce.com, Google Analytics and many others.


It uses meta-data to generate the appropriate, optimised queries for each type of data source. Data can even be obtained from a stored procedure that outputs a table object. Further, reports can be written that combine data from multiple data sources.

Transform Spreadsheets

Import CSV​

Our CSV functionality allows business users to transform their existing spreadsheets into reports. This means that any reporting capabilities can be quickly applied to spreadsheet contents, including the ability to drill down and categorise data.

Dynamic Visuals

Data Reporting and Visualisation

Easy to use

Drag and Drop Report Builder​

The Drag and Drop Builder allows users to use a pre-defined data view to build their reports without having to worry about SQL. This is the default builder, so once you’ve started the New Report creation process, you won’t have to select an advanced authoring option to proceed. From here you can start selecting the data set you wish to use for your report.

Customisable

Hundreds of Chart Types

Charts are the graphic equivalent of tables and cross tab tables. Our solution has a very powerful and easy-to-use charting feature which enables you to produce sophisticated and visually appealing charts to display a simple summary of your data, or to represent complex relationships within it.

Once you have selected data for your report, you can visualise the data in many ways by altering the attributes within in the chart.

In your own words

Natural Language Query

Natural Language Query (NLQ) allows a user to enter search terms or phrases as if they are speaking them naturally. This includes statements, questions or a simple list of keywords. Non-technical users can forge their own path through with any question they wish, choosing the suggested options that are offered to them.

Visual data

Data Storytelling

By combining real-time accessible data with insight, context and explanation, this feature makes analytics instantly more relevant, interesting and better understood. Whether you are giving a presentation or people are reading a data story, it really is the best way to share and collaborate on a single source of accurate, credible and secure information.

Plus anyone with a meaningful message can easily compose and share a Story. The simple interface springs data into life with images, video and embedded reports from other dashboard vendors.

Power your data

Data Transformation and Analysis​

Step by step

Transformation Flows

An integrated data extraction and transformation module to enable users to manipulate data into a format better suited to reporting and analytics. With this module, it is possible to extract data, transform it and then store the transformed data into a target database.

The Data Transformation module has a simple drag-and-drop builder to help you create Transformation Flows.

These flows consist of “steps”, each performing a different function. Following are the three main types of steps:

let rhino do the hard work

Auto Analysis

Advanced machine learning capabilities that assist users in the discovery and interpretation of data insights. These capabilities augment the capabilities of the user and enable them to analyse more data, find more insights and understand root cause – far faster than a human alone ever could.

Analysis tends to be time-series based and centred on key changes such as finding changes in total and average, trend direction, volatility, step shifts and outliers (spikes and drops). Typically these processes augment traditional methods such as dashboards and reports providing a richer analytics experience for end users.

beautify your data

Presentation and Communication

good looking data

Present​

Present is a fully integrated presentation module designed for data led communications. This module contains functionality similar to that of the dashboard canvas. A presentation slide supports the use of multiple types of content, including live reports, text, images, shapes and icons, action buttons, filters, and even code widgets.

Note: Each presentation slide has the same functionality as a dashboard canvas, including support for multiple content widgets, as well as dual editor modes and a preview mode. The same holds true for developer centric technology, such as Code Mode (that allows you to view and edit slide code and its contents), and Code Widgets (reusable widgets that perform advanced, interactive coding functionality on a slide).

in the know

Broadcast and Alerts

Keep everyone up-to-date on the daily, weekly or monthly results of the data with automatic broadcasts.

Broadcasting allows you to send a report to one or more users, based on a defined schedule and set of rules. A personal broadcast is exactly the same as a standard broadcast, with the exception of defining who it is sent to. A personal broadcast is only ever sent to the person that defined the broadcast.

share with your team

User Management and Multi-tenancy

management

Task Manager​

Tasks can be created and assigned to users for a variety of functions, covering simple ‘to do’ notes all the way through to data quality checks and content change requests. Each user then has the ability to manage both tasks they’ve requested, and tasks assigned to them, through their Timeline. 

control

Multi-tenancy

Allows multiple tenants within a single environment. This is primarily accomplished using a feature called “Client Organisations”. Client organisations provide each of your tenants with a siloed, secure, and customised experience within their own segment of the application, and offers several features for limiting user’s access to data at an organisational level.

All client organisations lie under a single primary “Parent” organisation that manages broad global settings, and provides an initial framework for content distribution.

Each user can belong to one or many client organisations, and which organisation they access in a given session is specified on login.

the world is your oyster

Customisation and Styling

Make it your own

Unlimited Customisation

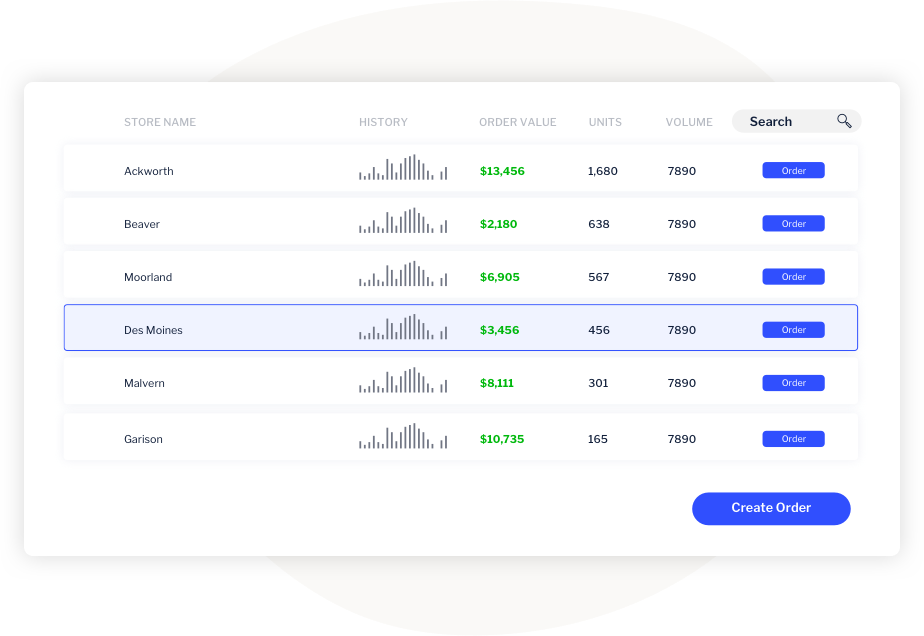
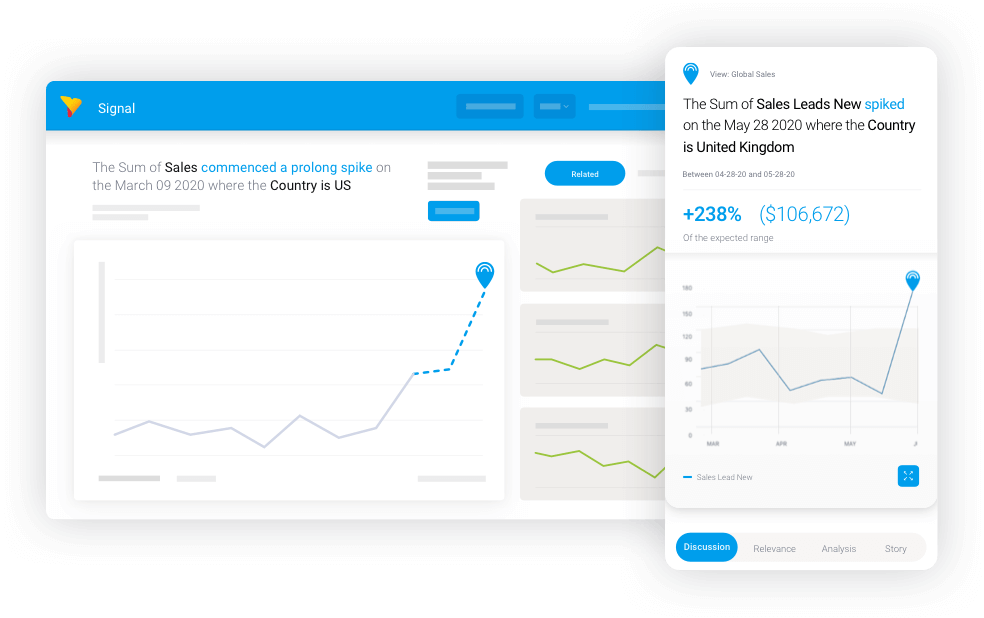
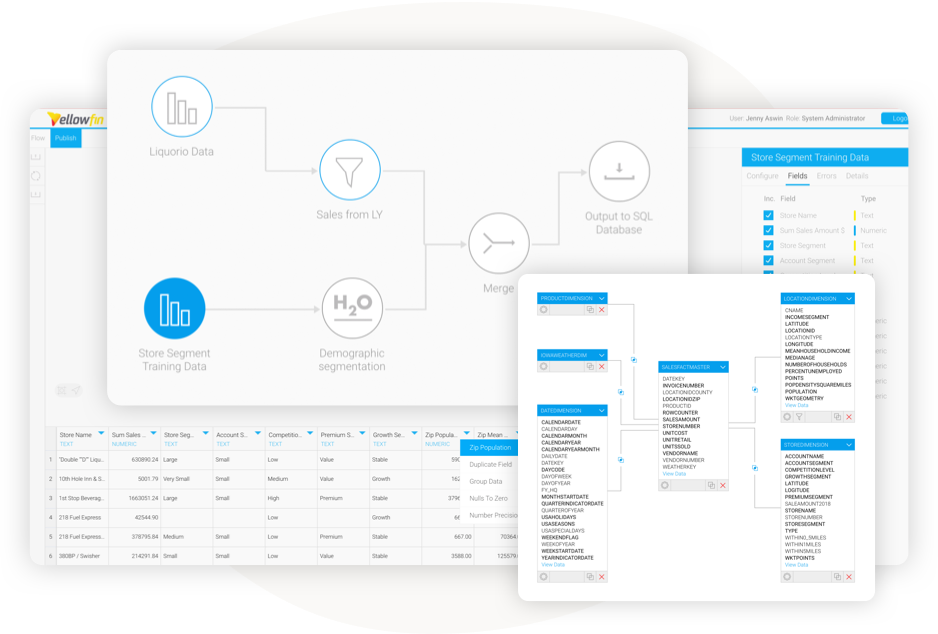
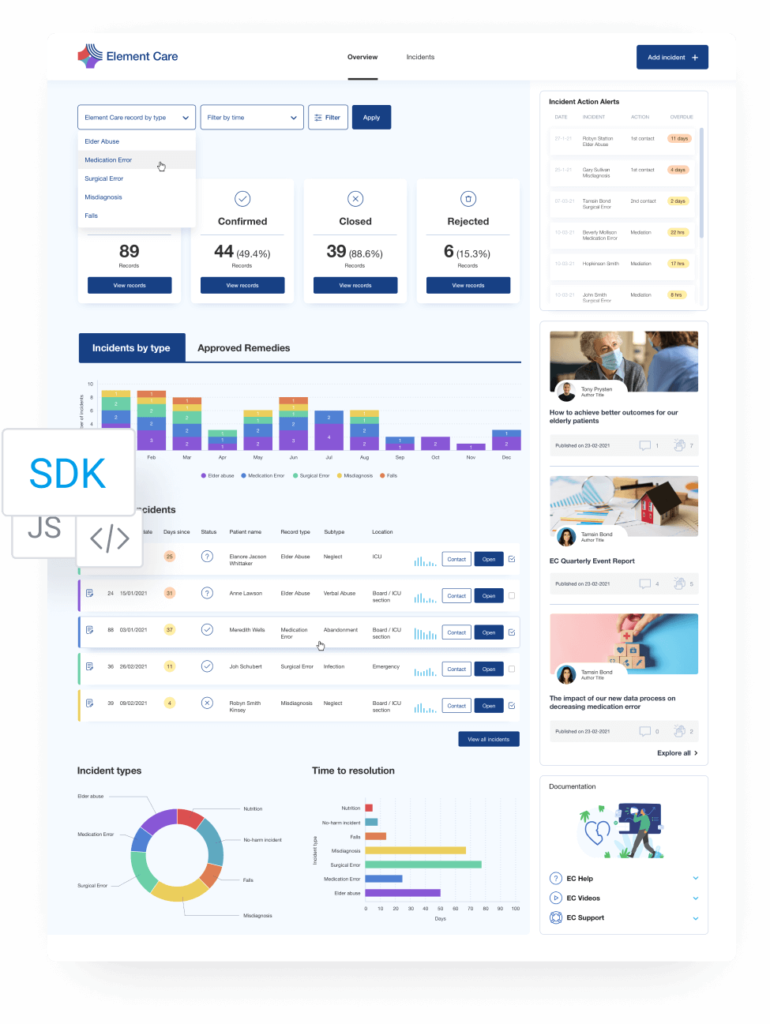
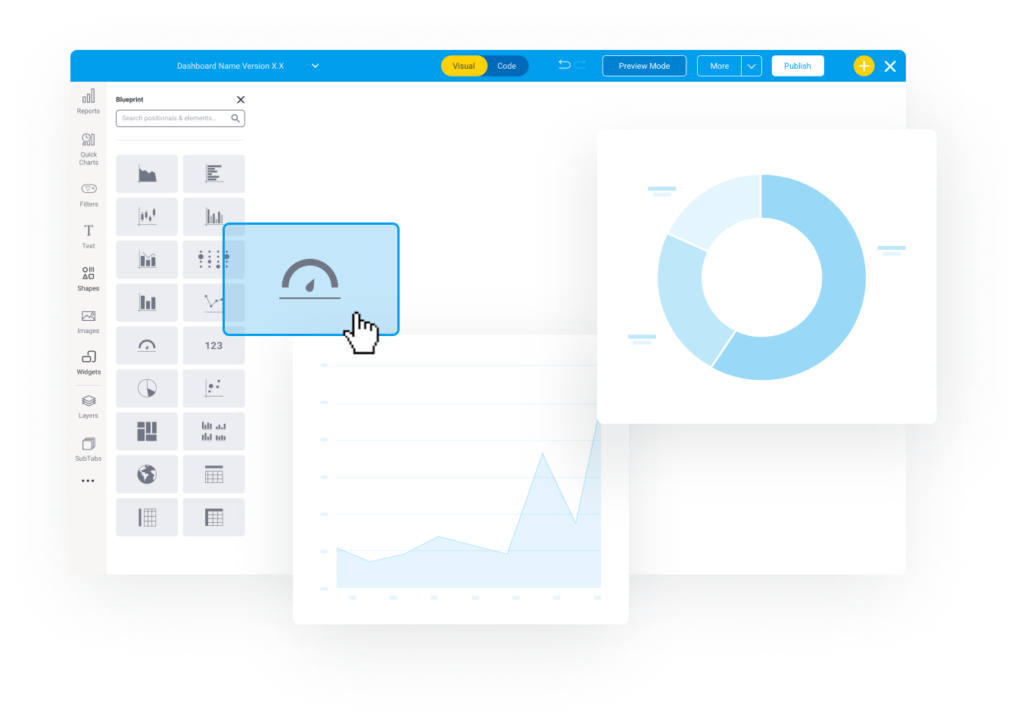
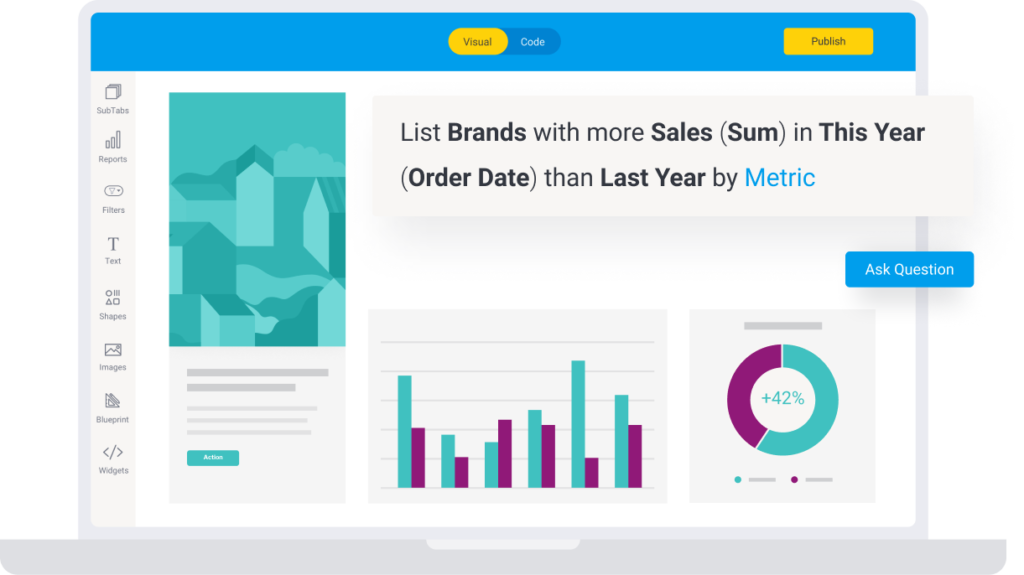
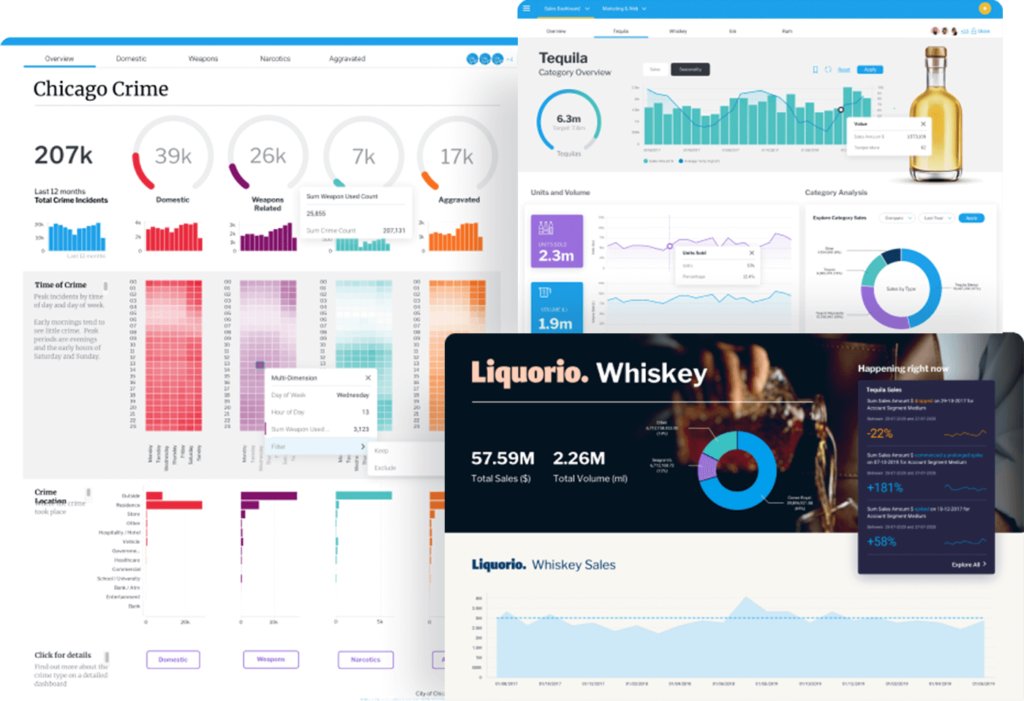
When creating dashboard content you are able to select from multiple layout options, these set a row and column-style layout such as full with column per row or 50% width columns two per row. The flexible option is a canvas dashboard which allows you to create your own layout within the canvas which allows you to have unlimited choice on the layout.

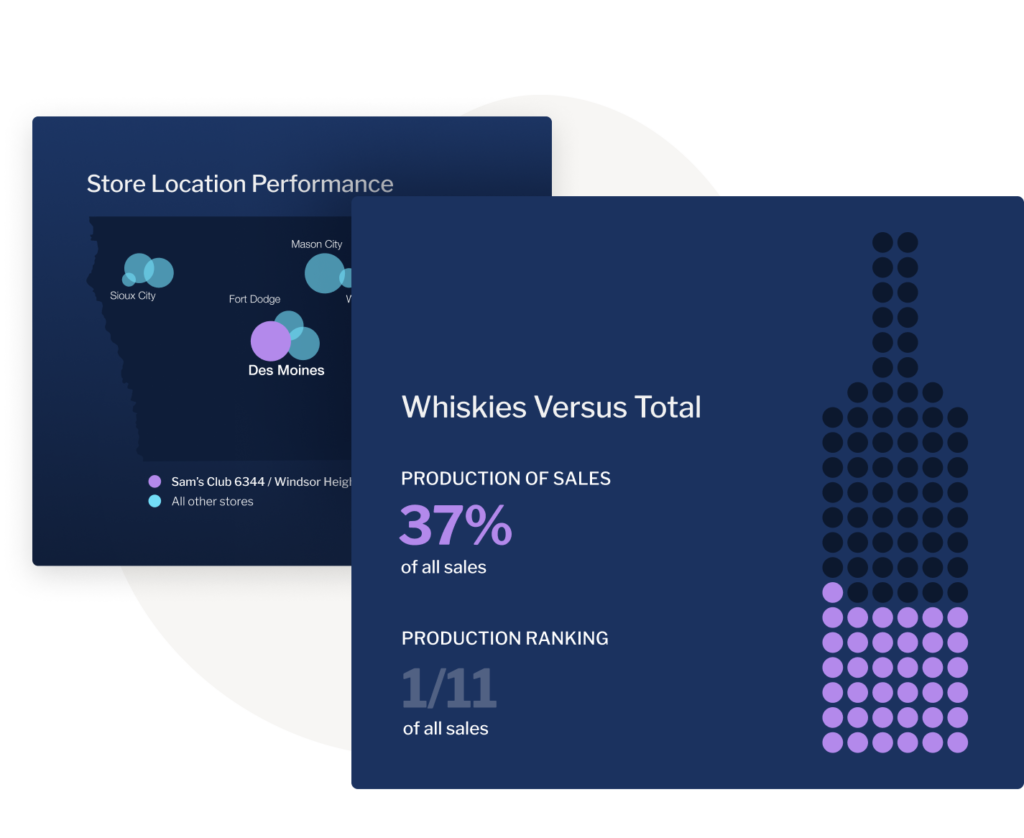
Using Dashboard Canvas, complex designs can be achieved with the ability to freely place a variety of rich content items in any position and to fine-tune the look and feel of those objects.